

In 2026, homeowners find themselves navigating a complex mix of rising costs, shifting economic pressures, and their own evolving expectations for home improvement products. Much like we experienced in 2025. While cost savings continue to matter, today’s DIYers are increasingly motivated to conduct projects themselves because of costs savings over hiring a pro, enjoyment of doing the work themselves, having access to high-quality resources and project tools, and the desire to control project timelines, rather than relying on a contractor.
At the same time, the demographic profile of DIYers is shifting. Millennials are aging into larger projects while doing more DIY, and Gen X and Boomers remain a major force in overall Home Improvement spend. And across all groups, digital behaviors are accelerating, from YouTube dominance to the fast rise of AI-driven research.
At The Farnsworth Group, we study the tangible implications of these patterns through custom market research for our clients. We also track changes more broadly for the industry via our Quarterly Homeowner Activity Tracker and our annual Building Products Customer Guide. These studies help home improvement manufacturers keep up to date on what matters most to the modern DIYer, and how to position their products for growth.
What are Recent DIY Trends in the Home Improvement Industry?
DIY behaviors are influenced by a variety of economic factors, as well as what’s going on in the housing industry as a whole and personal finances. Mid-way through 2026, there are several market trends influencing the home improvement landscape and DIY activity. Here is a closer look at what has happened so far in 2026, as well as what questions you should be asking about these insights in context of your own marketing, channel, and product strategies today.
1. Home Improvement Activity is Declining
Based on findings in our Quarterly Homeowner Activity Tracker, overall home improvement project activity fell in the second quarter of 2026 to its lowest level since tracking began. Home maintenance (or routine activities to maintain a home’s condition and prevent needs for major repairs) is anchoring demand, with 72% of homeowners completing that type of project.
Meanwhile, home repairs (fixing/restoring damaged, broken, or dysfunctional parts of the home) are decreasing. About 63% of homeowners who completed home improvement projects in Q2 2026 did repairs, compared to 69% in the same quarter last year. Home renovations (such as improving, updating, or remodeling) are holding steady at 36%, comparable to the preceding quarter and the same quarter in 2025.
2. Nearly Half of Homeowners Combine DIY and Contractor Labor
DIY motivations are shifting. While cost savings remains a major driver for DIYing a project cited by two-thirds of homeowners that DIY, the primary motivator in 2026 is now simply that “I’m able to do the work myself.”
According to data from our Homeowner Activity Tracker for Q2 2026:
- DIY hours increased to 38, the highest in five quarters
- Average dollar amount spent jumped to roughly $12,000, nearly doubling spend in Q1 2026
Our research findings reveal another shift: the increase of a hybrid approach that combines DIY labor with contractor assistance. This completion method was used by:
- 25% of homeowners in Q2 2025
- 20% of homeowners in Q3 2025
- 26% of homeowners in Q4 2025
- 46% of homeowners in Q1 2026
- 43% of homeowners in Q2 2026
Additionally, the data paints the picture of a more confident, capable DIY customer, one who chooses DIY not solely to save money, but because they genuinely feel ready to tackle the job. The higher DIY hours also reflect a more intensive active project pool.
Questions to consider:
- Which project categories are homeowners most confident tackling on their own?
- How can we position our products to reinforce confidence and reduce perceived complexity?
3. Financial Concerns are Steadily Rising Among Homeowners
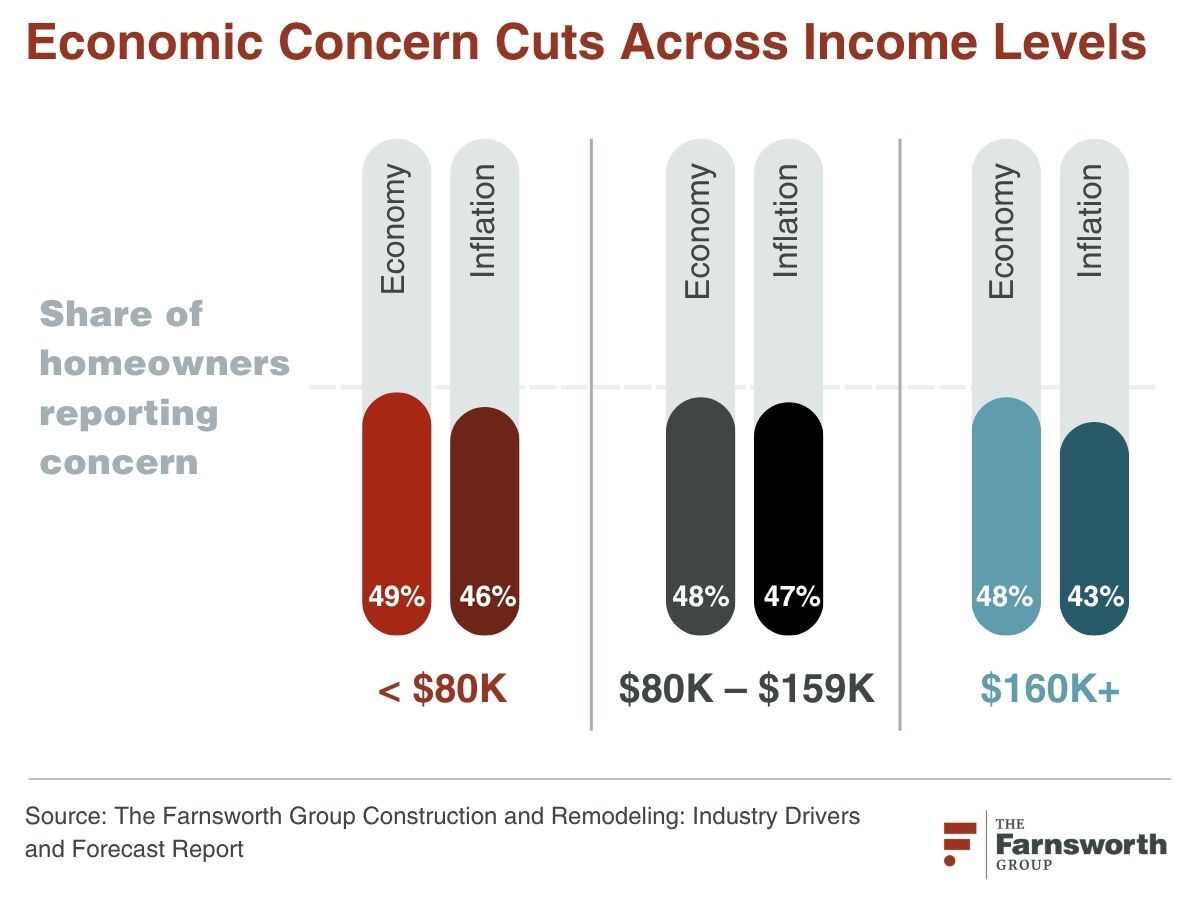
Financial concerns are heavily affecting homeowners in 2026, becoming an even bigger barrier to home improvement project planning for the upcoming year. According to findings in our Construction and Remodeling: Industry Drivers and Forecast Report, all income levels are concerned about the economy and inflation. Personal finances are also a concern for:
- 33% of homeowners with an income of $80K or less
- 30% of homeowners with an income of $80K to $159K
- 18% of homeowners with an income of $160K or more
Additionally, about 45% of homeowners were challenged by the cost of their home improvement project in Q2 2026, compared to 33% in the same quarter last year, based on data from our Homeowner Activity Tracker. Budget and financial reasons were also the reason for postponing or canceling planned projects for about two-thirds of homeowners, continuing to be the leading constraint.
Current Home Improvement Activity Sentiment Among Homeowners
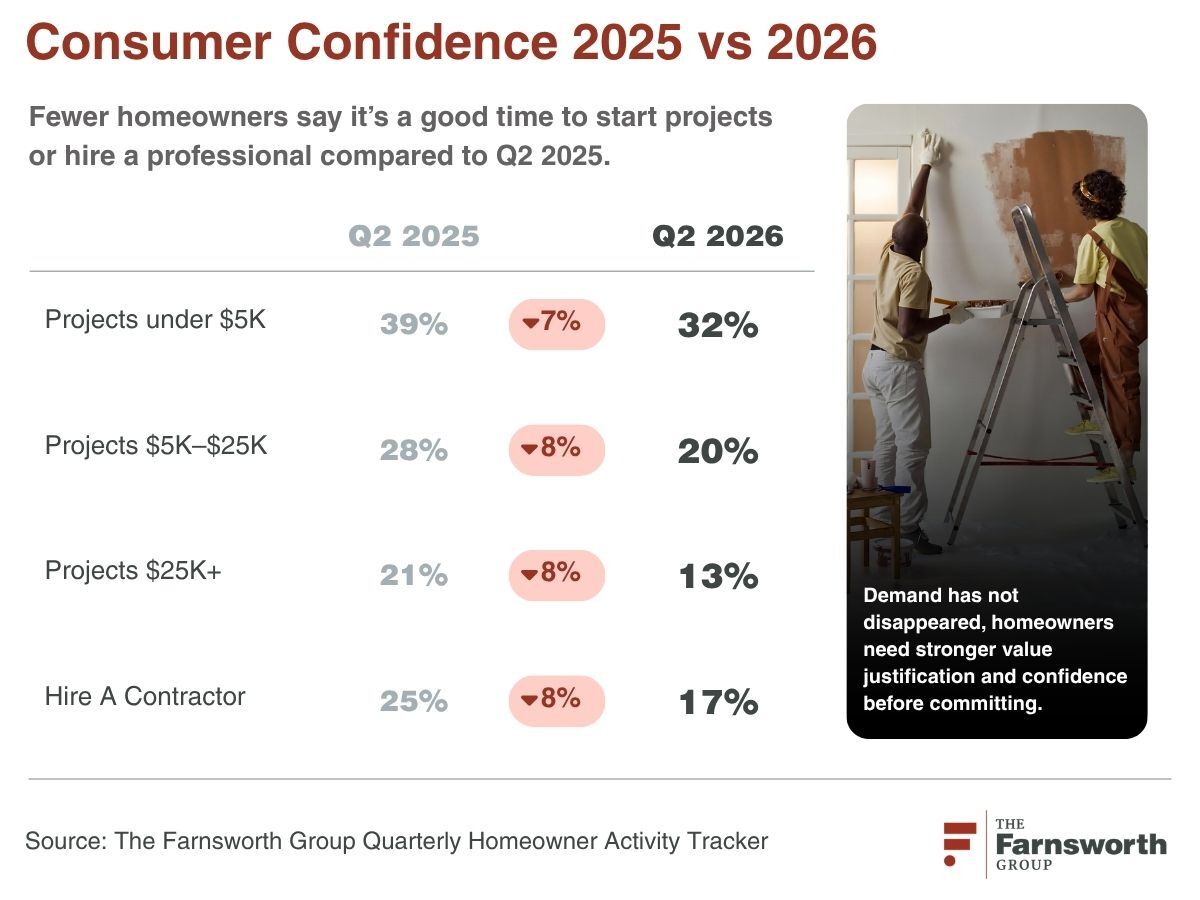
In general, homeowners are not expressing positive sentiment about home improvement activities of any size or scope. In Q2 2026:
- 34% of homeowners feel it’s a bad time to start a project $5K or less
- 54% of homeowners feel it’s a bad time to start a project $5K to $25K
- 66% of homeowners feel it’s a bad time to start a project $25K or more
- 46% of homeowners feel it’s a bad time to hire a contractor
Most notably, sentiment about projects under $5K turned negative for the first time since the fourth quarter of 2024. Individuals are showing caution about what they’re spending and where. Although there is still optimism about the value of doing improvement activities, it is currently tempered by realistic concerns about upfront costs.
In light of these financial concerns, manufacturers and suppliers must highlight the long-term value and ROI of various home improvement projects, especially as remodeling demand is currently shifting from transaction-driven to lifestyle-driven and homeowners show a desire to invest in place.
4. Quality, Availability and Price Continue to Drive Brand Choice
In general, DIYers are not particularly loyal to home improvement brands, especially compared to other industry stakeholders. The one exception is Heavy DIYers, or those homeowners who are most active in taking on their own home improvement and maintenance. For everyone else, brands that demonstrate quality and are in stock have an advantage.
The Farnsworth Group’s 2026 Building Products Customer Guide shows a sharply consistent trend across generations:
- Quality is the top brand driver (82% to 88% across generations)
- Availability is now nearly as influential as price
- Ease of use is increasingly important for younger DIYers
- Reviews influence 42% of Gen Z/Millennials during selection
- Boomers place more weight on brand familiarity and reputation
- Younger DIYers (63%) are more likely to try a new brand.
- Boomers (54%) and Gen X (46%) DIYers are more interested in sticking with brands they love.
By a large margin across demographics, brand selection continues to be driven by quality. Note that actual quality can differ from what purchasers perceive quality to be, and they make their decisions based on their perceptions. Approximately 86% of Heavy DIYers, 76% of Medium DIYers, and 65% of Light DIYers say high quality is a reason to continue using the same brand. The definition of quality will vary by category, so be sure to dig into what quality really means and what the market expects. The Farnsworth Group specializes in helping clients get a nuanced understanding of quality attributes and their value in the purchase decision.
Important Trends Related to Brand Loyalty
Availability, ease of use, and price are also primary factors, and should be taken into consideration during product development and marketing. Meanwhile, Baby Boomers are the most price sensitive, and more than half are willing to try a new brand based on price, while Gen Z are most compelled to switch brands based on availability.
From a retention perspective, brand loyalty is earned through experience, not loyalty programs or discounts. Heavy DIYers are the most loyal segment. This loyalty is built on consistent product performance. While 'loyalty programs' rank near the bottom of importance for all groups, these programs are often viewed much more positively by those in the program. Consider these programs as a way to reinforce those key attributes for your brand and category.

5. DIYers Remain Open to Trying New In-store and Online Suppliers
Supplier switching behavior is rising, especially among younger homeowners. Gen Z are the most open demographic, with nearly half saying they would try a new supplier, while only one in 10 Baby Boomers would. According to findings in our 2026 Building Products Customer Guide:
- 46% of Gen Z/Millennials tried a new supplier in the past 12 months
- Only 12% of Boomers switched
- Top reasons for switching were: Better prices; Needed products in stock; More options/choices
- Heavy DIYers choose new suppliers at even higher rates because of their higher project volume
This means DIYers will reward brands and channels that make buying easier, more transparent, and reliably in stock.
When purchasing a product in-store, the most important motivators are having items in stock and having a great product selection. When shopping online, a variety of factors come into play, with product availability edging out others slightly. However, an easily navigated site, where individuals can quickly find what they need, is also important. As a manufacturer or supplier, treat each purchase as an opportunity to build trust and loyalty.
Questions to consider:
- What triggers supplier switching in our category or for our products specifically?
- How do our availability and price perceptions compare to competitors?
6. DIYers Are Expanding Their Use of Multiple Purchase Channels
Channel behavior is becoming more fluid, not more concentrated. Overall findings from both our Homeowner Activity Tracker for Q2 2026 and our 2026 Building Products Customer Guide are that:
- Big-box retailers continue to dominate, but share has dipped slightly (67% in Q2 2026 compared to 75% in the same quarter last year)
- Local hardware stores are used by about one-fourth of homeowners
- DIYers regularly mix in-store, online delivery, and online pickup
- Heavy DIYers rely on more total suppliers and more purchasing methods
This makes channel consistency mission critical. DIYers should get the same product information everywhere they shop.
What are the Main Product Purchase Methods?
In-store purchases of home improvement products are still significantly most common, used by roughly half of homeowners. About one-third of homeowners also place website orders. Where there’s been a truly noticeable decline over the past year is online ordering and picking up in stores.
There can be sizable differences in channel behavior depending on the given product category, which is why conducting custom market research is important. This way you can understand where your specific customers are making purchases for your specific products.
7. Heavy DIYers Depend on Manufacturers Most for Support
Not surprisingly, Heavy DIYers are the most engaged with manufacturers; about 55% communicate over the phone and 33% through apps. Additionally, strong phone and email support are essential for this client base, while investing in app-based communication will help you connect better with tech-savvy segments, like Gen Z and Heavy DIYers. Meanwhile, younger and light DIYers are least likely to contact manufacturers, so brands must engage them through other indirect mediums to build trust and loyalty.
According to what DIYers reported in the 2026 Building Products Customer Guide:
- 37% contact manufacturers for warranty info
- 36% for product support
- 29% for availability
- 25% for pricing
Across all DIY levels, the No. 1 expectation DIYers have is for fast replacement or repair of faulty products. This ranks about five times higher than loyalty programs or rewards. Manufacturers should invest in responsive, multi-channel support options, streamlined warranty processes, and accessible product information.
8. Omnichannel Research Has Become the Default DIY Journey
DIYers rarely rely on a single source for product discovery. Instead, they move fluidly through a blended digital-physical research process.
Further, DIYers learn about new brands and home improvement products through a variety of methods, and their preference varies significantly by generation. For Gen Z and Millennials, online ads are the primary source for learning about new brands and products, whereas nearly half of Baby Boomers make discoveries in the aisle at brick-and-mortar locations. Millennials rely on numerous sources: online ads, brand and supplier websites, and in-store information. Building product manufacturers and suppliers must have a strong, omni-channel presence, with strong digital marketing to attract younger generations, while leveraging in-store experiences to connect with older DIYers.
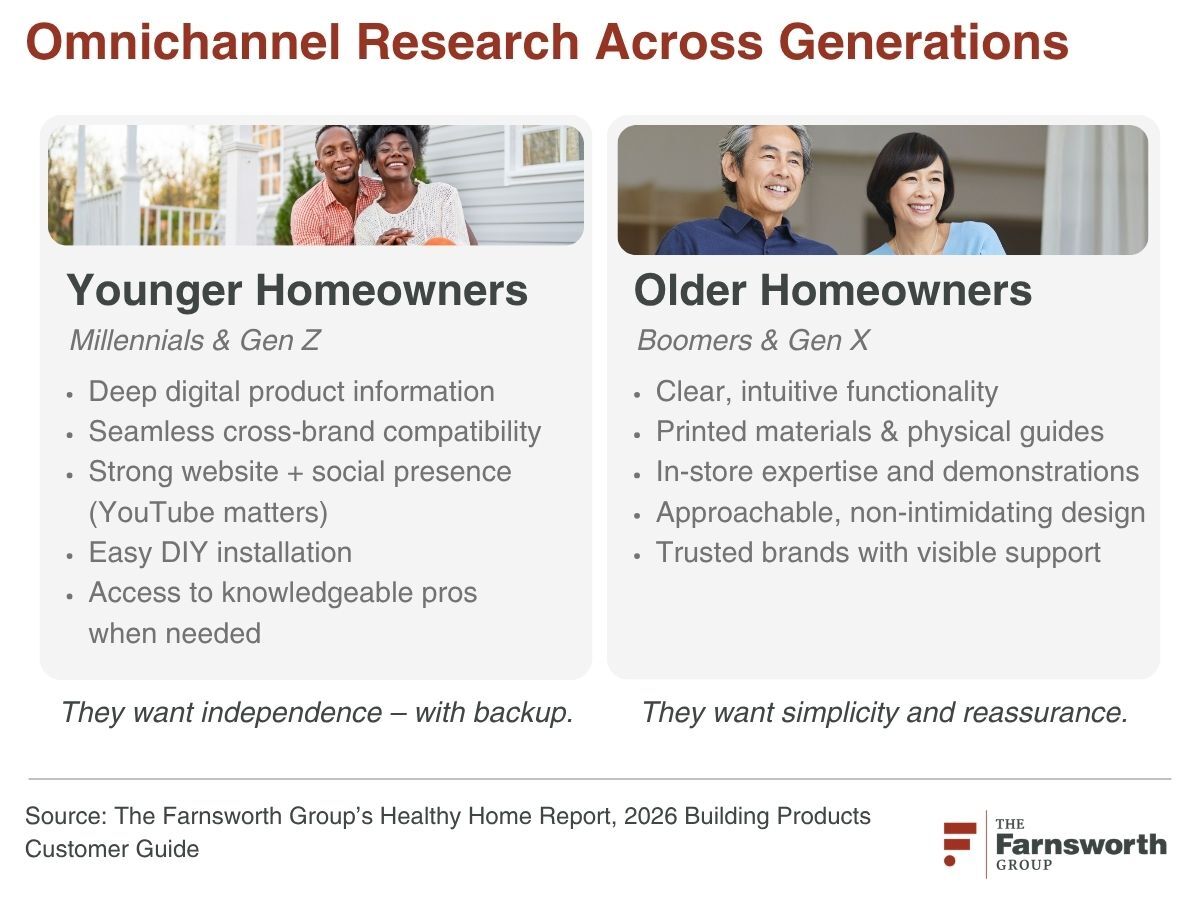
Specifically, our 2026 Building Products Customer Guide found:
- Retailer websites and Google are the top starting points
- Pinterest, Instagram, TikTok, and Reddit continue to rise
- AI tools (including ChatGPT) doubled in usage YoY, especially among younger DIYers
- 83% of Boomers research online before buying
For building product manufacturers and retailers, this means the digital shelf is not optional, it’s foundational.
Supporting DIY Homeowners with In-Store Research
Although digital channels are expanding, that doesn’t negate the importance or relevance of in-store research—particularly for DIYers. As DIY intensity increases, so does time spent in the aisle. Heavy DIYers are more than twice as likely (32%) as Light DIYers (4%) to spend multiple hours researching in-store, where they can handle products and talk to associates. For suppliers, that means having a knowledgeable staff and a readily available product breadth to help cultivate brand loyalty.
Ensuring product information is accessible in as many locations as possible can cater to the research-heavy habits of DIYers. Content should align with factors consistent across the DIY purchase journey: pricing information, stock availability, comprehensive product information, and user-generated reviews. This content should be available in both digital and physical mediums to meet the needs of older segments and boost trust and convenience across your distinct customer base.
9. “How-To” Videos Are the Most Influential Content Format
Videos are the most trusted and consumed media format for DIYers. They are especially drawn to how-to or instructional videos on YouTube.
According to the 2026 Building Products Customer Guide, YouTube is used to research and learn about home improvement products by:
- 80% of Gen Z/Millennial DIYers
- 72% of Gen X DIYers
- 67% of Boomer DIYers
TikTok and Instagram also remain strong for product discovery among younger buyers Manufacturers must invest in short, clear, step-by-step installation videos, preferably optimized for mobile and YouTube search.
Questions to consider:
- Which content formats does our DIY customer prefer for our category?
- Should we have a YouTube-first content strategy with short, clear installation videos?
10. Sustainability Matters Only to a Small, Younger Segment
For years, there's been lots of talk about positioning around sustainability, so it's worthwhile to see if that is moving the needle among current DIYers. Based on our research findings, sustainability is not a top-tier purchase driver currently, but it does matter to a specific, growing audience. Out of 16 attributes studied in the 2026 Building Products Customer Guide, sustainability ranks 12th overall.
The report found that:
- Only 12% of Gen Z and Millennials cite sustainability as important when selecting a brand
- That drops to 9% for Gen X and 6% for Boomers
- When deciding whether to continue using a brand, sustainability rises slightly to 16% for Gen Z/Millennials, 11% for Gen X, and 7% for Boomers
- Among DIY intensity groups, Heavy DIYers show the highest interest at 17% versus 11% Medium and 7% Light
While sustainability can differentiate products for younger homeowners, it remains far less influential than quality, availability, ease of use, reviews, and price. What this means is that today, brands should treat sustainability as a secondary or tertiary differentiator, not a core purchase or retention driver.
What Questions You Should Be Asking to Strategize?
As we head into the end of 2026 and the beginning of 2027, the trends above point to a rapidly evolving DIY landscape where quality, availability, omni-channel experiences, and digital research patterns increasingly drive purchase decisions. But understanding what is happening is only your first step. Leading building product manufacturers go deeper by asking the right questions about their customers, products, and growth opportunities in the last quarter of 2026 and the upcoming year.
Below are some of the critical questions that marketing leaders, product managers, brand managers, and insights teams should be asking across five core areas:
Customer Usage, Attitudes, and Path to Purchase
- How are our customers discovering and researching your product category today?
- What role do YouTube, social media, and AI (like ChatGPT) play in their decision-making journey?
- Where do they make their purchase and why that supplier?
- Where do customers get stuck in their journey, and where are we losing them?
Segmentation & Customer Profiling
- Which segments (Generational, Attitudinal, Occasion-Based) represent our highest-value growth opportunity?
- What share of the market do your ideal segments represent?
- Do our current personas reflect reality in 2026 and heading into 2027 (video-first, digital-first, availability-driven)?
- Which segment does our brand or product best align?
Product Development & Concept Testing
- What jobsite or in-home problems are customers still trying to solve that we have not addressed?
- What features do users actually value and what can be deprioritized?
- Does our packaging or in-store-facing content clearly communicate product benefits?
- At what price point do we lose share on shelf?
Brand Health, Loyalty, and Competitive Positioning
- Where are we strong and where do competitors outperform us (quality, reviews, availability)?
- Where in the sales funnel are we below the market?
- How does loyalty vary across demographics and segments?
- What gaps do we need to close to improve our market perception?
Market Sizing, Channel Strategy & Category Growth
- How are sales shifting across channels (big-box, local hardware, Amazon, D2C online-only)?
- What is the share of sales across DIY and Pro segments?
- What is the true size and growth trajectory of our category over the next three to five years?
- What share do we have in the overall market vs key competitors?
Winning Over DIYers with Custom Market Research
Determining how to position your building products among various DIY segments is a constantly moving target, as we've already witnessed in the first half of 2026. Conducting regular market research to understand your buyers, evaluate your brand messaging, and determine your best go-to-market strategy will remain increasingly important as competition remains high for DIYers limited dollars.
While the above are generalizations of DIY behaviors and attitudes, you can learn more about how DIYers are responding to forces within your specific building product category and for your specific products by conducting custom market research with our expert researchers. Tell us more about what questions you're needing to answer by booking a consultation.

Frequently Asked Questions
What are the latest DIY statistics for home improvement projects?
DIY behaviors and statistics are influenced by a variety of economic factors, as well as what’s going on in the housing industry as a whole and personal finances. According to data from The Farnsworth Group’s Homeowner Activity Tracker for Q2 2026, average DIY hours among homeowners increased to 38, the highest in five quarters, and the average dollar amount spent on projects jumped to roughly $12,000, nearly doubling spend in Q1 2026. Our research findings also show that there has been a steady increase in DIYers utilizing a hybrid approach that combines DIY labor with contractor assistance.
What are the most popular DIY home improvement projects?
The most popular DIY home improvement projects are related to maintenance, repair, and small-scale renovations, rather than large remodels and discretionary upgrades. This includes tasks like painting, replacing broken fixtures, replacing damaged flooring, installing new shelves or cabinets, and outdoor landscaping and gardening. The Farnsworth Group’s Homeowner Activity Tracker offers deeper insights into DIY motivations and behaviors and the top challenges facing homeowners.
What are recent trends in the home improvement industry?
Based on findings in The Farnsworth Group’s Quarterly Homeowner Activity Tracker, overall home improvement project activity fell in the second quarter of 2026 to its lowest level since tracking began. Home maintenance is driving demand, with 72% of homeowners completing that type of project in the past quarter. Meanwhile, home repairs are decreasing, and home renovations are holding steady. The demand for home improvement is present, but consumers are increasingly budget sensitive and feeling concerned about starting projects of all sizes, with the most positive sentiment regarding projects in the $5K and under category.
